The project called for extensive business and scientific analysis, thorough planning, UI/UX design, and possible web development. With a project this delicate and complicated, we had to make sure we would be able to guard everyone’s best interests—both our client and the end users—while creating a powerful, user- friendly web application.
In order to do this, we decided to use a technique called story mapping. This proved to be a good way to start thinking and talking about the user flow of the application and was valuable in creating a solution. For more in-depth information on the story mapping technique, check out the book User Story Mapping, Discover the Whole Story, Build the Right Product by Jeff Patton and Peter Economy (2014).
Framing the idea
Before starting on the story map, it was important to get a sense of why our client wanted to build this new software, who the users would be and how our client wanted to measure success.
To gather this information, we met with our client’s product owner and the subject matter experts. We used the opportunity canvas as a tool to guide us and help us ask the right questions. (created by Jeff Patton & associates, http://jpattonassociates.com/opportunity-canvas/).
This opportunity canvas was copied on a large piece of paper. Per item, ideas were discussed and put on the canvas using sticky notes. We noticed that when people can see these different elements and work with them, it becomes much more tangible. The canvas became something that we could easily play around with and change or remove sticky notes when needed. Our scientific analysts best understood the business challenges of our client and thus were the ones who guided this exercise.

The completed opportunity canvas gave us a better insight into the business requirements. Based on this information and our own scientific experience, we were able to make some well-founded assumptions about how the users would interact with the application. We were now ready to begin outlining a software solution. Together with one of our designers, we began with a basic wireframe of the application. A wireframe was a quick and easy way to communicate our idea of the application visually with our client and the end users, so everyone would be on the same page.
Before starting on the story map, it was important to get a sense of why our client wanted to build this new software, who the users would be and how our client wanted to measure success.
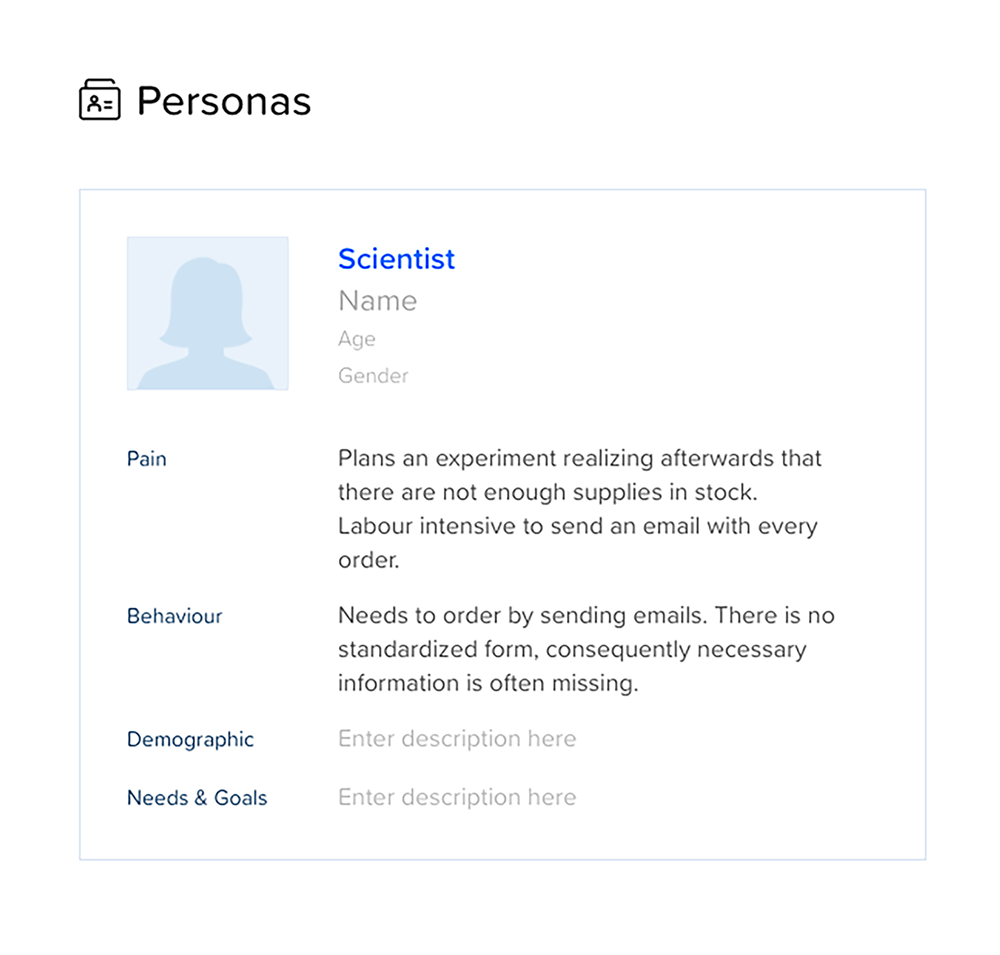
Based on our client’s feedback, we could start the story mapping to refine our initial ideas and improve the basic wireframes. A first step was creating personas to describe the roles of the users within the organisation, their current pain- points, daily activities and how they would interact with the new application. For this, we used a web application called craft.io.
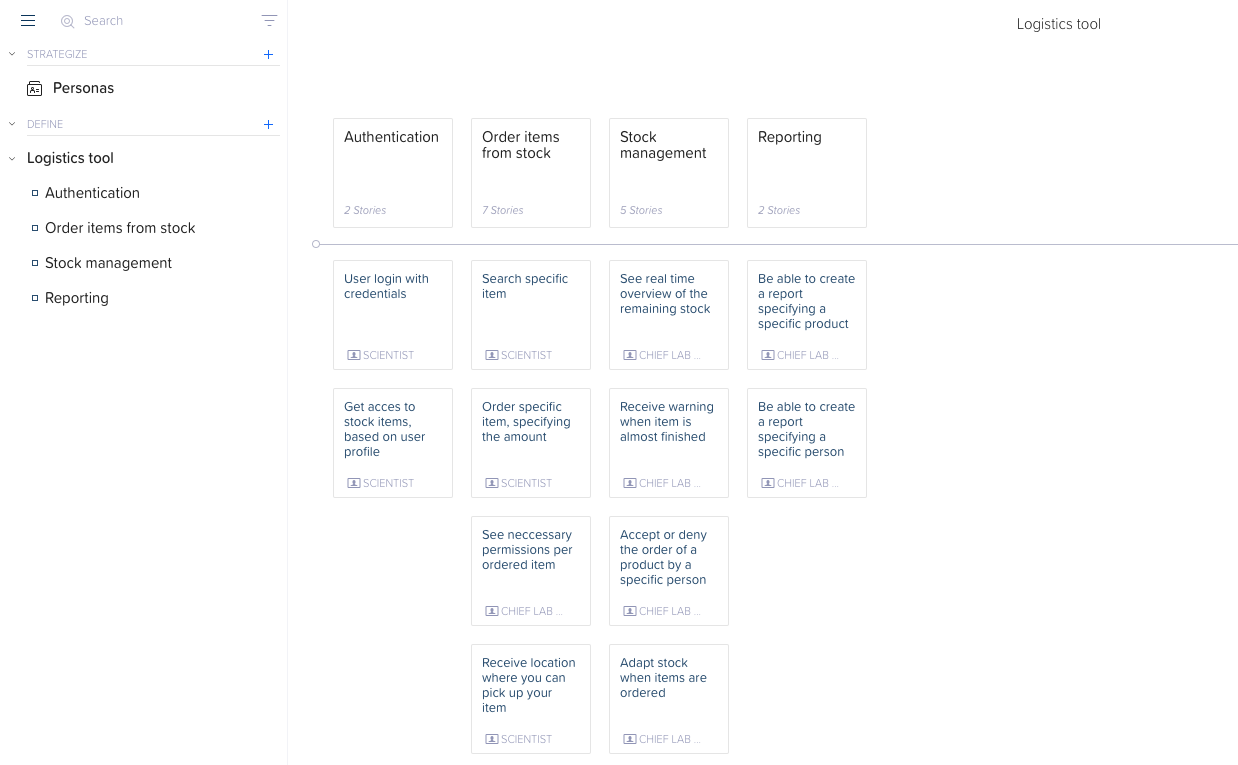
The story mapping technique made it easier for us to define the user flow and user interactions. Moreover, together with the wireframes, it served as valuable input to develop an initial prototype of the solution that could be validated by the users and was a starting point to define the roadmap for the final solution.
To continue with our UX design research, we organised interviews with real end-users. These users were selected by the customer and represented different user groups that would interact with the application. First, we asked some general questions about their activities, the problems they are facing and how a software solution could help them in their daily activities. This allowed the users to talk to us with an open mind.
In the second step, we showed these users the wireframes we created to illustrate the solution we envision. This enabled us to challenge and validate our solution idea together with the users. Although we truly value the information we received by asking the open questions, presenting the wireframes helped us to make the solution more concrete, which ultimately led to more specific user feedback. The experience of our scientific analysts with the data, technology and scientific terminology strongly facilitated the interaction with the end- users.
Based on these user interviews, we further improved the wireframes and stories on the story map and enhanced them with more details. The new storyboard and wireframes were then presented to the product owner to determine priorities. Based on these, the minimal viable product (MVP) was outlined. This is a first release with a minimal set of features that is useful for the users. All other remaining features were then categorized for future release.
Interactive design prototype
Next, the story map and wireframes were converted into an interactive design prototype using InVision. In this prototype, the user experience was mimicked and optimised, and additional visual elements such as company branding and colors were added. The interactive prototype was presented to the user to receive feedback regarding the usability.
To come to a prototype solution that meets their different needs, story mapping can be a valuable way to visualize and merge the different features.
Based on this interactive prototype, it was also much easier for our developers to envision the solution and how it should work. This allowed them to make better estimates about the effort it would take to develop the solution.
Conclusion
For custom-based software solutions, we find it very important at XAOP to deliver a product that is supported by all parties involved. This includes both our clients and the users that will interact with the application. To come to a prototype solution that meets their different needs, story mapping can be a valuable way to visualize and merge the different features. It is, moreover, a good starting point for prioritization, a first step towards a solution roadmap. We’ll definitely be using this technique again for future projects.